Certified data gathering and processing system
Compatible with Linux, Windows, MacOS, Solaris
Compatible with x86, amd64 and ARM CPUs
Works with all Polyservice data processing units
100% based on OPEN API
| |
Revised October 2, 2022
| Architecture | Operating system | Version | Restrictions |
|---|---|---|---|
| x86, x86-64 | Microsoft Windows | 7, 8, 10, Server 2012, Server 2016, Server 2019 and up | Unlimited |
| x86 | Microsoft Windows | XP, Server 2003 | Java 8 does not officially support versions of XP and Server 2003 operating systems; support for Java 6 and Java 7 versions is provided under a separate contract with limited functionality. |
| x86, x86-64 | Debian | 9, 10 and up | Unlimited |
| Arm64, Armhf, MIPS, PPC | Debian | 9, 10 and up | There may be limitations from the video subsystem and JDK / JRE |
| x86-64 | Red Hat Enterprise Linux, Oracle Linux, CentOS | 8 and up | Without Borders. The video subsystem requires the installation of components from EPEL |
| Armhf (Including Raspberry Pi) | Raspberry Pi OS (formerly Raspbian) | 2020-08-20 and newer | Restrictions are imposed by the processor performance, the amount of RAM and the presence of hardware acceleration of the video subsystem in the system. |
| x86, x86-64 | Astra Linux (Rusbitech) | - | Support is provided under a separate contract. |
| x86, x86-64 | Rosa Linux (NTC IT ROSA) | - | Support is provided under a separate contract. |
| x86, x86-64 | ALT Linux (SPO Basalt) | - | Support is provided under a separate contract. |
| x86-64 | macOS X | 10.12 (Sierra) and later | There may be limitations related to video subsystem support. Support is provided under a separate contract. |
| Title | Minimum Version | Recommended version |
|---|---|---|
| openjdk | 8* | 11** |
| Oracle JDK, Oracle JRE | 8* | 11** |
| Liberica JDK | 11** | 11** |
* We currently support running on JDK/JRE8, but we strongly recommend using JDK11 as this is the current LTS version and support for v1.8.x may be discontinued by us for the foreseeable future.
** Note that there is currently one open bug in JDK11 (our April report: https://bugs.java.com/bugdatabase/view_bug.do?bug_id=JDK-8265324 ) that makes it impossible stable use of TLSv1.3 enabled by default. To use the channel encryption module in conjunction with JDK11 (and all newer versions at the moment) you must disable TLSv1.3 by adding the line jdk.tls.disabledAlgorithms=TLSv1.3 in the jre/lib/security/java.security file
| Working hours | Processor | RAM | Free hard disk space | Video card |
|---|---|---|---|---|
| Server only | 2 cores 1GHz | 1-8 GB (depending on the number of connected devices) | 10 GB + space for photo verification archive | with VESA/VGA support |
| Client or client+server | 4 cores 2GHz | 4 GB | 10 GB + archive for photo verification | 1280x1024 resolution support (1920x1080 recommended), 2D hardware acceleration support and h.264 decoder recommended (when using video subsystem) |
| System | Restrictions |
|---|---|
| Raspberry Pi 3, 3B | Stable operation of more than 250 connected devices is not guaranteed due to the small amount of RAM. Supports GPIO module, supports device-level hardware redundancy. |
| Raspberry Pi 4 | Performance limitations of drawing graphic plans when connecting monitors with a resolution of 3840×2160. Please note the higher requirements of the board for the microHDMI interface cable. Supports GPIO module, supports device-level hardware redundancy. |
| Olimex A20, Olimex T2, Olimex A64, Waveshare A20 | Boards based on Allwinner processors are supported without warranty, stable operation of more than 250 connected devices is not guaranteed due to the small amount of RAM and low performance. GPIO module not supported. |
Standard HID devices are supported. The server can be managed entirely over the network. The system server software is designed to use the keyboard as the main data input source. The workstation software is designed to use a mouse (or other XY input source - touchpad, trackball, trackpoint, etc.) and a keyboard for data entry. If you do not have a physical keyboard, you can enable the option to use the virtual on-screen keyboard, which is available for a limited set of input data. Touch screen support is present but does not guarantee full functionality of the client software.
To open the virtual keyboard, use the “keyboard” button located next to the input field.

The on-screen keyboard contains the following controls: - An input field where the input value is formed. It can be adjusted using either the on-screen keyboard or the physical keyboard. The input field contains a cursor that points to the current input position in the field. - The “<-” button deletes one character located to the left of the cursor in the input field - The “С” button deletes the entire content of the input field - The “OK” button completes editing and transfers the content of the input field parent form - The Cancel button terminates editing without submitting the content. As a result of pressing, the content of the parent form remains in the state in which it was before the on-screen keyboard - Buttons with alphanumeric characters add the value indicated on the button to the input field to the right of the cursor, i.e. the “a” button will add the character “a” to the input field. - The “Shift” button sequentially changes the case of the entered characters - for example a->A->a - The **“EN" button changes the input language from Russian to English and vice versa - The ”Space“** button adds space in the input field to the right of the cursor - The “<” “>” buttons allow you to move the cursor in the input field to the left and right, respectively.
basic version of the software supports single monitor configuration up to 3840×2160 (4K)
When ordering additional modules, the customer software supports multi-monitor configurations with each display resolution up to 10000x8000 and arbitrary formation of the operator’s working environment.
final software structure depends on the connected modules and the hardware configuration of the platform, this description shows the maximum possible variant of the structure formation.
Please note that depending on the presence or absence of database encryption modules and / or disk storage, system files can be located both in encrypted and in plain text.
ISO Topol software consists of the following elements:
- Topol .jar - Main program file - server.properties - Server settings file - client.properties - Client settings file (operator workstation or device GUI) - topol3.jks - Storage security certificates - authorization certificates, public key certificates and corresponding private keys for the encryption module. In the absence of encryption modules, this file must have limited access not only for writing but also for reading! - webupdate.jar - The file is generated when updating the system over the network, it is a copy of the current software - ** db/** - Database location directory, contains the following directories: - log/ - event log location - settings/ - settings database files location - ext/ - Directory, files in which is accessible through the built-in HTTP/HTTPS servers, contains the following directories: - plans/ - location of files for backgrounds of graphic plans of objects - DLOG/ - location of signal registration files in .dlog format - VIDEO/ - location of video subsystem archive files, in most configurations it is a pointer to an array of disk drives - PHOTO/ - location of archive files of the event photo verification subsystem, can be a pointer to an array of disk drives - AUDIO/ - file location in the archive of the acoustic event verification subsystem, may be a pointer to an array of disk drives
Run the command line interpreter. Before running the software for the first time, run the java --version command. The result of executing the command should be information about the available Java runtime environment version 8 or higher, for example:
openjdk 11.0.6 2020-01-14
OpenJDK Runtime Environment (build 11.0.6+10-post-Debian-1deb10u1)
OpenJDK 64 -Bit Server VM (build 11.0.6+10-post-Debian-1deb10u1, mixed mode, sharing)
If as a result of running a command, the console reports that it cannot find the command:
need to install Java JRE or Java JDK version 8 or later.
To run the software from the console, go to the folder with the Poplar ISO software using the cd command, run the application launch command in the required mode:
| Launch mode | Team |
|---|---|
| Server | java -cp Topol.jar en.topol3.Server.Server |
| Client | java -jar Topol.jar |
The command can be saved as an executable file (eg .sh for *nix systems or .bat for Windows OS) for further calling without using the console.
| Color | Status |
|---|
| Disarmed, Norma |
Table of colors of states
When you start the remote operator workstation (AWP) software, the first window displays the server connection dialog:

Server connection dialog
The dialog box has: - A field for manually entering the IP address of the server to which you want to connect - Fields for entering user credentials - A “Available servers” table, which displays servers located in the same subnet with the client - the “Bookmarks” table, which contains pre-stored server addresses.
To connect to the server, specify the IP address by entering it manually in the IP input field, or by selecting the server from the table of available servers, or by selecting it in the bookmarks table, username and **password* *, then press the button “Connect”
Please note! In the list of available servers, only servers that have the broadcast server option enabled and are within the L2 network (i.e. (i.e. not located behind a router, VPN channel, etc.)
When you click on the “Connect” button, the login dialog will be closed, and instead a window with the connection status will be shown.
The top part of the window displays the IP address of the server to which connection, in the central part - the current connection stage, in the lower part of the window - the button to cancel the connection.
Wait for the connection to the server. The connection status window will be automatically closed, the software will display the main window of the remote operator workstation.

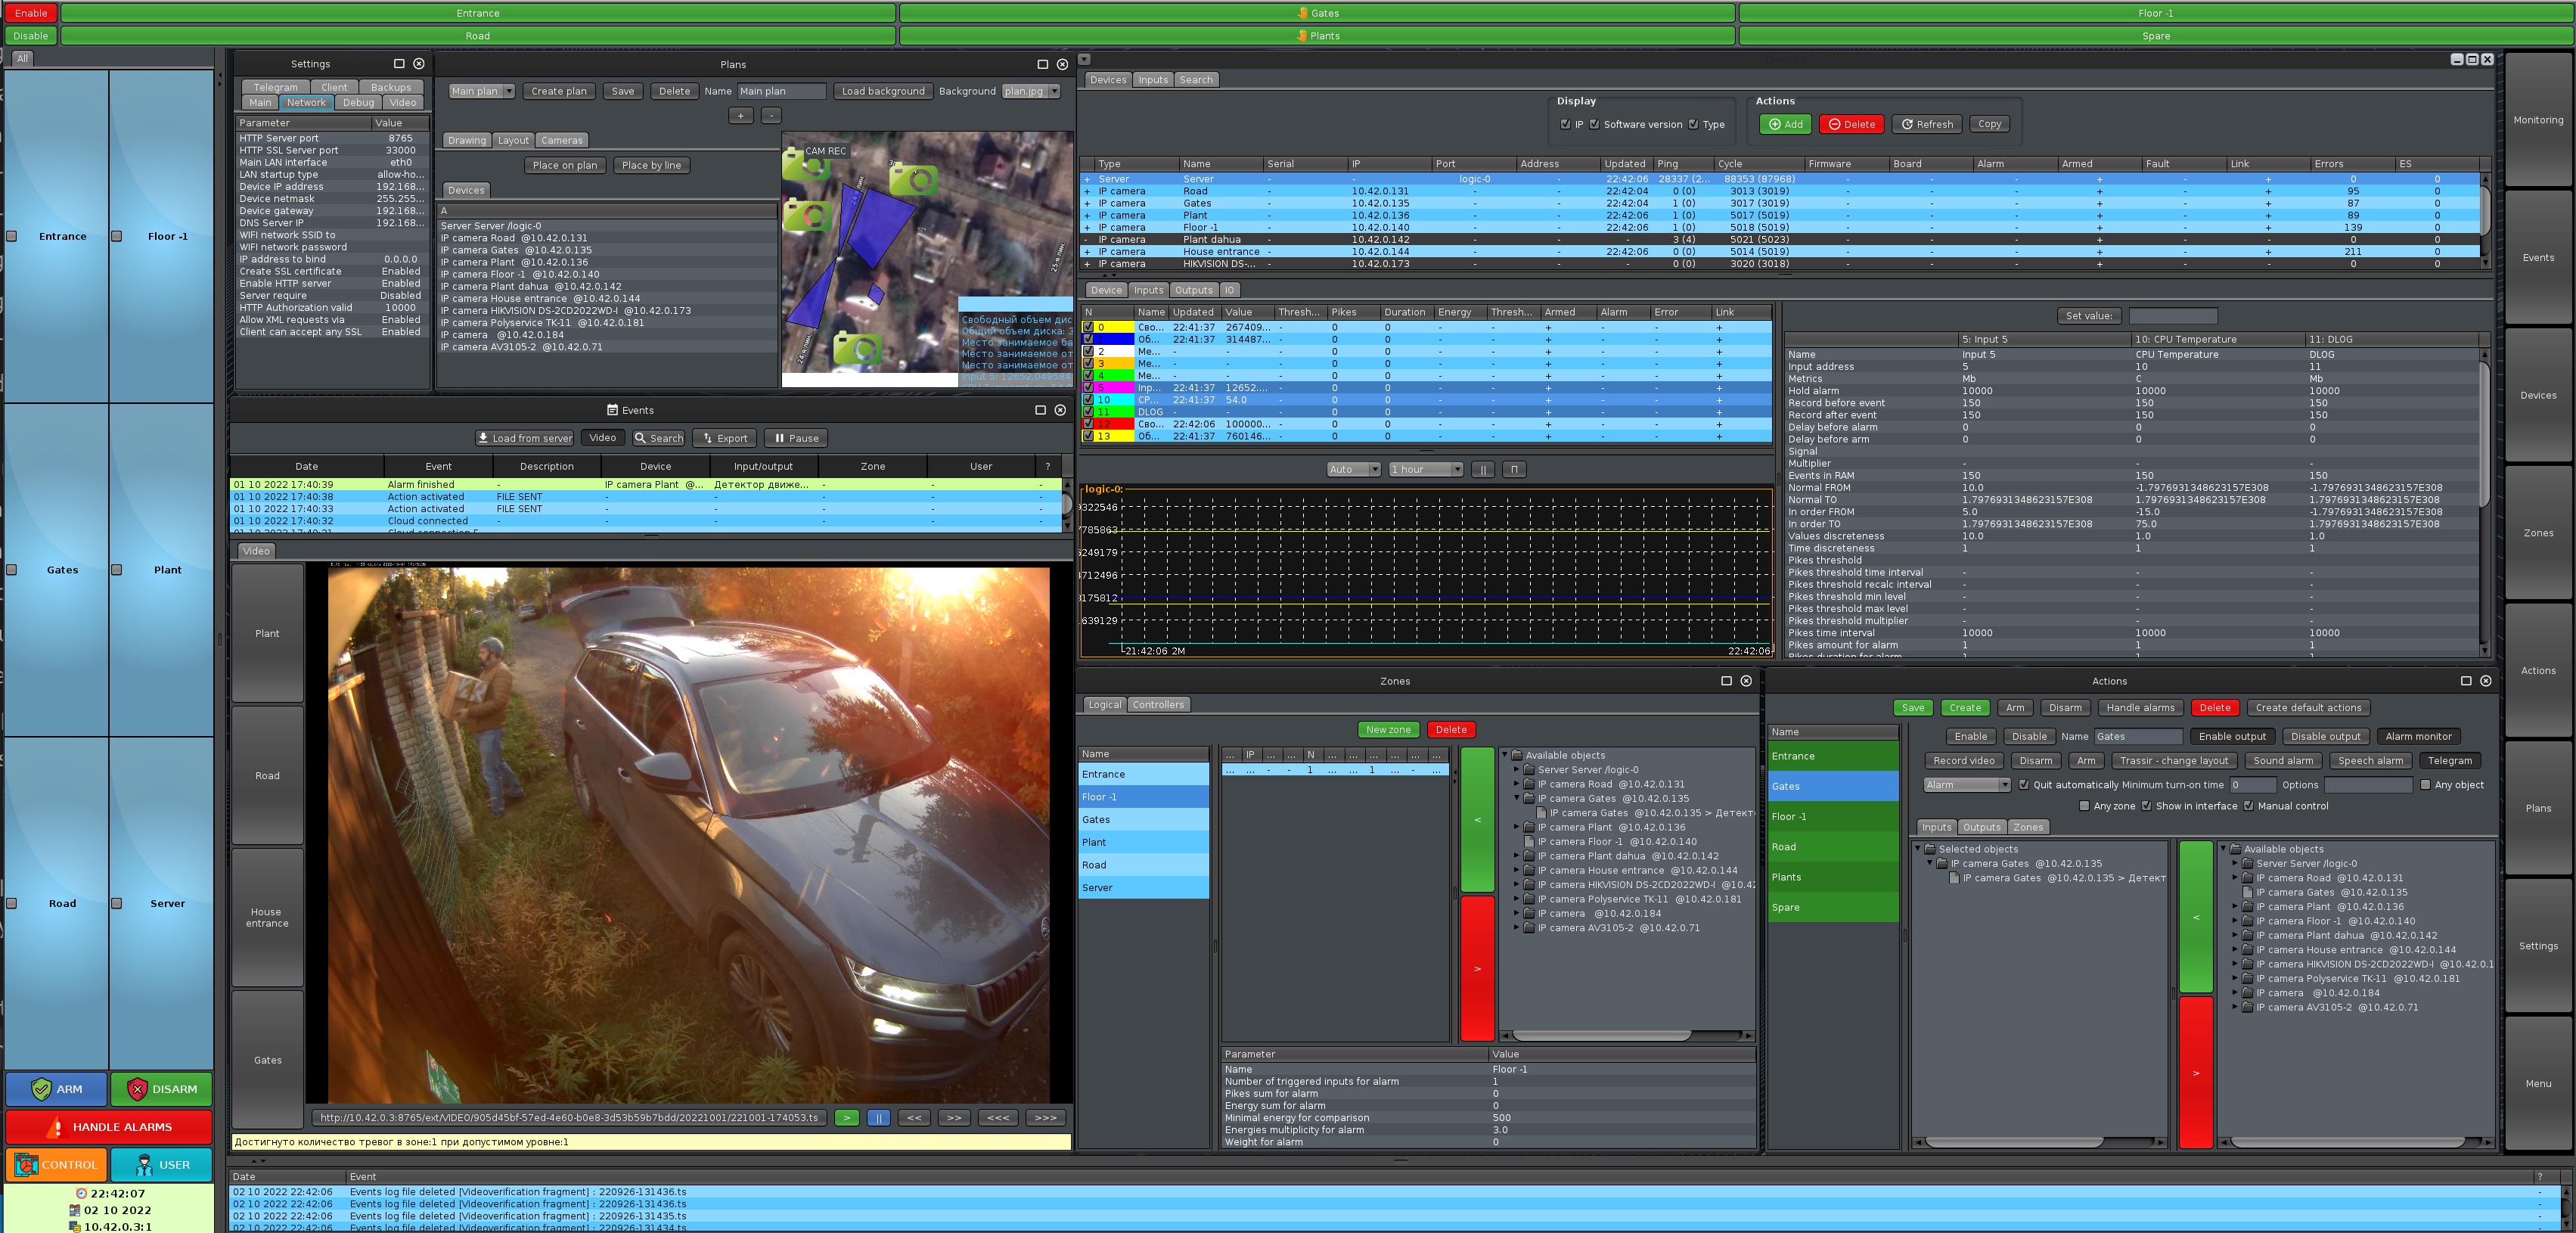
Main window of the remote operator workstation
Main windowremote workstation of the operator is divided into four areas:
1. Zone controller, which displays the current states of the object’s zones, and also manages them. 2. Graphic plans of the object, which display the current state of the object on the graphic plans. 3. Event log, which displays events with sources and actions. 4. Application call panel, which contains buttons for calling applications in system management mode, and the “Monitoring” button to return to monitoring mode.
Panel The panel displays the available zone controllers and the zones themselves within those controllers.

Zone Controller Panel
At the top of the Zone Controller are tabs that switch between pre-created controllers and a “All” tab that all zones that exist in the system are located.
Each controller’s tab displays only the zones that are included in that controller.
Zone cells are interactive, to the left of the name of each zone there is a check box that displays the current selection of this zone.
The number of columns for displaying zones is configured for each controller individually in the controller settings in the “Zones” control panel
Under the zone controllers, there are control buttons: - “Arm” - arm all selected zones (the checkbox in the zone cell is checked) - “Disarm” - disarms all selected zones - “Process alarms” - ends all alarms in all selected zones. Please note - if the alarm generation criterion is preserved at the moment of alarm completion (for example, the signal exceeds the threshold level), then the system will generate a new alarm immediately after the current - “Control” - activates the remote control panel - “** Duty**" - activates the duty control panel
The current (remote) control panel helps in assessing the state of the system at the current time. The panel is called by the “Control” button on the zone controller panel.

The panel displays system loops that are disarmed, have malfunctions, have no connection, or which generated an “alarm” event. If the contents of the panel is empty, then all loops of the system are operational and armed.
At the same time, the data of the panel is fixed at the moment of its opening (the date and time are displayed in the upper part of the panel) and are not updated until the “Refresh” button is pressed or the panel is closed and opened again.
In the basic version of the system without a user management module, there are two options for controlling the interface: - Without restrictions (CLIENT_LOCAL_LOCK = false in the client configuration) - Without taking into account the rights of the current user with typical viewing-management restrictions. (In the client configuration, the parameter CLIENT_LOCAL_LOCK = true)
In the second case, when starting the client software, the operator has access to only the “Monitoring” and “Events” modes.
To access other modes, you must click on the “On duty” button and enter the lock password, which can be specified in the client configuration file in the “CLIENT_LOCAL_LOCK_PWD” parameter

In case of self-installation of the client software, please note that storing a password in a configuration file implies restricting access to this file, including at the reading level, by means of the operating system
The colors of the elements display the current statuses of objects linked to the elements of the plan, depending on the settings, the information may be duplicated by text.
If more than one graphical plan is configured in the system, then tabs are displayed at the top of the area, allowing you to select a plan to display.
If the current operator’s workstation has the “Automatic switching of plans” option enabled, then the plan will be displayed, the elements of which have the status “Alarm”, if several plans have elements with the status “Alarm”, then the plan with the most recent alarm message will be displayed.
More details about the elements of the plan can be found in the description of the editor of graphic plans.
log The event log displays the last 1000 events since the system server was started (the value can be changed in the server settings). Events are displayed in a last-on-top fashion and are colored according to the status color table.
The table has the following columns:
- Date - date and time when the event was recorded - Event - text description of the event, including decryption of the event code, names of system elements (inputs, devices, zones, users, and etc.) who participated in the event and additional information. - ? - if the symbol - is displayed in this field, then all available information is displayed in the “Event” column, if the symbol + is displayed, then the event has additional attached reference information - it can be a signal recording in case of alarm, graphic images of photo or video verification, detailed description, etc. Double-clicking an event in the log will open the extended event log application with a detailed description and additional attached information (see paragraph 6.1 “Advanced event log”)
launcher The application launcher is located on the right side of the main window. It is used to switch between monitoring and configuration modes, as well as to quickly call the main applications of the system. The panel contains the following buttons:


The action bar can be displayed at the top of the window.
To display it, two parameters that define the appearance of the panel should be filled in the client configuration with non-zero numerical values:
- CLIENT_GUI_ACTIONS_HEIGHT - defines the height of the panel in pixels - CLIENT_GUI_ACTIONS_COLS - sets the number of columns in one row
The panel displays actions, in the settings of which “Show in interface” item is selected

If the “Manual control” mode is selected for an action in its settings, it is displayed on the panel with the corresponding hand icon:

Such actions can be selected with the mouse, the selected actions change background color and are displayed in a checkbox icon:

Selected actions can be forced on or off using the “Enable” or “Disable” buttons in on the left side of the panel
Please note: - Manual control does not take into account the settings of the action on the time of switching on - in the enabled action will be activated until it is manually disabled or until the first event that disables it in automatic mode - Manual control does not disable automatic - if an action is enabled in manual mode, it can be disabled automatically by its script based on events that occurred after manual control
To prevent sabotage or erroneous actions of the operator, events cannot be edited, events cannot be deleted selectively, only complete clearing of the event log is possible through the “Database Administrator” service application, which cannot be launched simultaneously with system server.
The volume of stored events depends on the capacity of the disk storage of the central unit, in the minimum configuration it is 10 million events, provided that no photo or video event verification data is stored on the disk. By default, the server starts cyclically overwriting the oldest events with the most recent ones, if there is less than one gigabyte of free space left on the disk. The duration of event registration can be changed in the server settings, however, to exclude the sabotage method by specifying a deliberately incorrect minimum registration duration, it cannot be less than one week, while the fact of changing this setting is recorded by a separate event in the log indicating the active user.
The extended event log is invoked by pressing the Events button in the application call bar

The current event log is displayed at the top of the application, which allows you to select any event for detailed viewing. The log has the following columns:
- Date - date and time when the event was recorded - Event - decryption of the event type - Description - description of the event - Device - device that participated in the event or - if no devices participated in the event - In/Out - input or output that participated in the event or - if no inputs or outputs participated in the event - Zone - zone to which the event is related or - if the event does not belong to zones - User - if the event is anonymized, then - is displayed, otherwise, the surname and initials of the user who participated are displayed in the event. - ? - if the + symbol is displayed, then the event has additional information. When such an event is selected, the panel will be divided into two parts, the lower of which will display tabs with attached data (in the example above, the photo verification tabs and the data recording log are displayed) and a detailed description of the event (displayed at the bottom of the panel on a yellow background).
At the top of the log control panel is a button Download from server - when you first open the application, it only displays the latest events since the server was started, however, all event logs are available on the server itself. When you click this button, the application will offer to download the necessary log files from the server:

Window for downloading log files from the server
The table displays two columns: - File - log file name in the format “YYYYMMDD” where YYYY = year, MM - month, DD - day the log was written. - Size (Kb) - log size in kilobytes
The log download panel has three control buttons: - Refresh list - re-requests the server for a list of available logs (Deprecated, will be removed in future versions) - Load selected - loads the selected log file - Cancel - closes the panel without loading logs
The Search button on the log control panel provides access to a quick search for events by type, device, input, etc.
The Export button allows you to export selected events in HTML or CSV formats (Microsoft Excel is supported).
The Pause button allows you to stop the incoming stream of events for this panel until the next click. Please note that the event stream stops only for this panel, in the general event log and on other event panels, new events will continue to flow into the pool.
All data that devices transmit to the system are presented as a set of input loops - temperature, vibration level, status of dry contact inputs - all these are separate inputs that can participate in the formation of logical and comparison zones , be the initiators of system actions and create your own events. For each input in the system, registration of input data is available with personal (for each input - its own) settings for the duration and discreteness of registration. For each input, personal settings for the normal state and the criteria for generating the notification “Alarm” and “Fault” can be set. Each loop can participate in a zonal comparative data processing model to make a decision about an alarm not only by the level of the input signal, but also by comparing its signal with the signals of other system inputs. For each input, the calculation of the adaptive threshold can be enabled and the number and duration of the signal exceeding the threshold can be calculated. For each input, it is possible to analyze its energy component both in the basic version and based on an independent adaptive threshold. The output circuits of devices in the system are presented in the form of logical outputs that can change their state both as a result of performing actions programmed by the user, and forcibly at the command of an operator or a top-level system in which ISO Topol is integrated. Control of the state of the output circuits is carried out for devices that support this function at the level of the data exchange interface. The output circuits do not have to be discrete (on-off), the system allows you to transfer any output values to devices, and if the device physically supports the modulation of the output circuit, then the system allows you to use this feature.
The device management application is called by pressing the Devices button in the application launcher

Main window of the device management application
The application is designed to manage devices connected to the system.
The tab contains:
- The Display group, which contains flags for filters of information displayed in the instrument table. When the filter checkbox is unchecked, the column corresponding to it in the instrument table will be hidden, when the checkbox is checked, it will be displayed. - The Actions group containing the buttons:
Add - displays a panel for manually adding a new device to the system

Provide port name the device is connected to, the address of the device in the connection port, and enable or disable device polling. When you click on the Create button, a new device with the specified settings will be added to the system, when you click on the Cancel button, the dialog box will be closed without creating a new device. Please note that if the Poll button is not pressed when creating a device, the device will not be polled until polling is enabled in its settings.
Delete - removes all selected devices from the system. If a root device is selected that contains hierarchical descendants in the device tree (for example, the VO-BOS-6 processing unit), then all its slave devices will also be deleted (for example, for VO-BOS-6, these are all VO-ZONEs related to this BOS)
Important! Each device has its own unique system identifier (UUID) generated in accordance with RFC 4122 “A Universally Unique IDentifier (UUID) URN Namespace” https://tools.ietf.org/html/ rfc4122 This allows you to accurately specify a specific device in events, zones, actions and other elements of the system, however, it should be borne in mind that after removing one device from the system and adding a similar device with the same address, it will be a completely different device from the point of view of the system and its you will need to re-add to all the necessary zones, actions, etc. Moreover, when deleting and re-creating a device, new UUIDs are created for all its elements - input and output loops, slave devices, etc., each of them will similarly be a new element for the system.
Search - opens the automatic search panel for finding new fixtures (Deprecated, in future versions the functionality will be moved to the “Search” tab of the fixture management application)
Update - when clicked, the client forces a re-request of the full tree of fixtures from the server .
Table of devices, which displays the following columns: - First column (no name) - if the symbol + is displayed in the column, then the device is switched on and participates in the polling of devices. If the symbol - is displayed, then the device is disabled and excluded from the poll - Type - device type - Name - device name. Instrument names are editable during system setup and are used for convenient labeling and identification of instruments. - Serial number - serial number of the device or - if the device does not contain a serial number. - IP address - if the device is connected via LAN, then its IP address or the address of its entry point to the LAN is displayed (interface converter or the device with the highest hierarchy, for example, for VD-5 vibration sensors connected via RS-485 to the network LAN , the IP address of the LBOS to which they are connected is displayed). If the device is connected directly to the server, then - - Port - physical or virtual port to which the device is connected is displayed. For example, for VD-5 vibration sensors connected via RS-485 to LBOS, this is the number of the LBOS port to which they are connected, for VO-BOS-6 this is the name of the port by which it is connected to the server, and for devices of the VO-ZONE type virtual (logical) port, which separates zones from different VO-BOS among themselves. - Address - address of the device in the port to which it is connected. As a rule, this is the physical address of the device in the RS-485 network or the serial address of the device in the virtual port. A number of devices (vibration sensors VD-3, VD-5, DD-1, seismic sensors SD-3) support automatic addressing after installation; serial number of the sensor for the initial comparison of the device in the system and the physical device in the line - Updated - time of the last successful update (read or write session) of data from the device - Ping - time that the session of reading or writing data takes from the device, while the session may or may not be successful. The column displays two digits - the time of the last reading or writing session is displayed without brackets, the average session time is displayed in brackets. - Cycle - time between two polling cycles (sessions of reading/writing data) of the device, while the polling can be both successful and unsuccessful. The column displays two numbers - without brackets, the time between the last two sessions, in brackets - the average time between sessions. The difference between the data in the Ping and Cycle columns is that the Ping column displays the access time to the device, i.e. how much time has passed from the moment of the beginning to the moment of the end of the communication session with this device (it does not matter whether the communication session was successful or not). The Cycle column displays the time between two consecutive communication sessions - the end of the last one and the end of the previous one. For example, with the following connection scheme:

for VD-5 sensors, the value Ping is equal to the time it took the server to communicate with the sensor via the LBOS and receive all the necessary data, and the value Cycle shows how long it took to poll other sensors in the line and how often new information comes from a particular single sensor.
If the time in the Cycle column exceeds 5000ms (i.e. 5 seconds), then the declared time for transmitting an alarm notification of 5 seconds cannot be guaranteed and correct operation with equipment with a short alarm hold time is not guaranteed - you need to check the settings server, reduce the number of devices in the line, fix problems that lead to interruptions in communication, or use a faster interface for communicating with the device.
The difference between the data in the columns Errors and OP: For example, if after starting the server, communication with the device cannot be established during three consecutive polling sessions, then in the columns Errors and OP the number 3 is displayed, if the device responds properly to the fourth poll, then the Errors column displays the number 3, and the OP column displays the number 0. If communication with the device is lost again within 3 more polling cycles, then the Errors column will display the number 6, and the OP column will display the number 3, if the connection is restored at the next polling cycle, the Errors column will display the number 6, and ** the number 0 will be displayed
Under the instrument table, the instrument management application displays the properties panel of the selected instrument.
The panel contains three tabs:
tab is divided into two parts and displays the current status of the instrument and its main settings.
In the upper part of the tab, there is a button to enable/disable polling of this device
In the device status, the following is displayed:

In the device settings, the following are displayed and available for editing:
 - Name - name of the device in the system - Description - detailed description of the device - IP - IP address of the device - Port - port to which it is connected device - Address - address of the device in the port to which it is connected - Participates in the ACS - if the device contains access keys, controls the passage or is an access verifier, then “Yes” is displayed, otherwise it is displayed “Not”. Disabling participation in the ACS allows the use of devices that can physically participate in it, exclusively for security purposes. - Options - string of additional device parameters (for example, local oscillator settings for VO-BOS) - Do not update the device more often than - allows you to limit the frequency of updating the device. For example, there is no need to update more than once per second sensors that change their readings at a frequency of 1 Hz. - No connection if the device has not been updated within this time - specifies the time interval in milliseconds that is given to the device to update the data. If during the specified time the communication session with the device was not established for any reason (the device did not respond or the polling cycle time of the line to which the device is connected exceeded this value), then the message “NO COMMUNICATION” is generated for the device and all its inputs and outputs .

The “Inputs” tab displays information about the inputs of the selected fixture.
The tab displays a table of instrument inputs, with the following columns:
- # - input number. This cell is interactive and allows you to select which of the input signals will be displayed on the plotter - the checkbox to the left of the number shows whether the signal of this input is displayed on the plotter at the current time or not. To enable or disable the signal display on the plotter, click on the cell with the mouse. The background color of the cell shows what color the signal value of this input is displayed on the signal plotter. - Name - the name of the input - Updated - the time when the input data was last updated (in most cases, this is the time of the last successful connection with the device) - Value - the current values of the input signal - Threshold - current threshold level of the input signal - Breaks - current number of threshold exceeded by the signal during the exceedance analysis - Duration - current duration of the threshold exceeded by the signal during the exceedance analysis - Energy - current accumulated energy during energy analysis - Energy threshold - current energy threshold - Arm - indicates whether the input is currently armed - Alarm - indicates whether there is currently an active notification “Alarm” on this input - Errors - shows whether there are currently errors (exchange or according to device messages) at this input - Communication - shows whether there is currently a connection with this input
Under the table of inputs a signal plotter is located that displays a graph and values. The plotter has three controls: - Scale selection - selects the display scale along the Y axis, possible values: - Auto - the display scale will be automatically calculated so that the signal occupies the maximum possible area of the plotter. - 100:1, 10:1 - the signal will be visually enlarged by 100 or 10 times respectively - 1:1 - the signal is displayed in the “signal unit = one pixel on the screen” mode - 1: 10, 1:100, 1:1000 - the signal will be visually reduced by 10, 100 or 1000 times respectively - Value range - indicates the display scale along the X axis, possible values: - Nearest - if more than one signal (input) is displayed on the plotter, then the x-axis scale will be automatically selected so that the panel displays data only for the time interval that is available for all signals. For example - when displaying two signals, data for one of which is available for 10 minutes of time, and for the second only for 3 minutes, only 3 minutes of time will be displayed on the panel. - Far - if more than one signal (input) is displayed on the plotter, then the scale of the X axis will be automatically selected so that the panel displays all available data. For example - when displaying two signals, data for one of which is available for 10 minutes of time, and for the second only for 3 minutes, the panel will display all 10 minutes. - 1 day, 1 hour, 10 minutes, 1 minute, 30 seconds, 10 seconds, 5 seconds - display data for the corresponding time interval. - Button | | suspends automatic redrawing of the plotter
The plotter displays the following data: - Solid color line - input signal graph, color of the first cell in the input table corresponds to the color of the line - Dashed color line - input signal threshold, color of the first cell in the input table corresponds to the color of the line - Dash-dotted color line - input energy threshold, the color of the first cell in the input table corresponds to the color of the line - White dotted lines - plotter grid - To the left of the main field, the vertical division value of the grid is displayed (the numbers correspond to the signal amplitude) - Under the main the field displays the horizontal division price of the grid (the numbers correspond to the time of signal registration - in the lower left corner the beginning of the displayed data sampling, in the lower right corner - the end of the displayed data sampling, under the third grid cell on the left, the division price of one grid cell is displayed)
When one or more elements in the input table, a panel opens onselected inputs:

The following settings are available for editing: - Name - input name - Input number - input number.
It is strongly not recommended to change the input number without a serious need and a clear understanding of how it will affect the operation of the system!
To do this: 1) Select the inputs whose values you want to change in the input table. You can select several inputs using the Shift button (while holding down the Shift key, all inputs between the first and second mouse clicks on the rows of the table are selected) or using the Ctrl button (when the Ctrl button is pressed, only those inputs are selected that the user clicks on, for operating MacOS systems - the Command button is used instead of the Ctrl button):

In the settings table, select the current values of the parameters that need to be changed:

Set a new value, which you want to assign to the parameters, in the field to the right of the Set value button
Click on the Set value button
In the example above, the values Record before the event and Record after the event are selected for the inputs " Vibration level" and “Case opening sensor”, which will calculate the value 200 instead of 150 after pressing the button Set value, while the parameters of the input “Temperature” will not be changed because they are not selected.

The tab displays available device outputs in a table with the following columns: - # - output number - Type - output type - Output name - output name, editable by the operator - Fault - displays active output fault - Communication - displays presence of communication with the output at the current time - Enabled - displays status output - if the symbol + is displayed, then the output is enabled, if - it is disabled
Two buttons Enable and Disable allow you to control the state of the selected outputs (if the selected device supports remote control of these outputs)
The Instruments tab allowed to configure the inputs of only one selected device, the Inputs tab allows you to simultaneously view signal graphs and configure the inputs of various devices
The Inputs tab window is divided into three areas - p a panel with controls, a table of available inputs, and a workspace that displays signals and input settings.
The Inputs tab is the main one when setting up the system devices, we recommend that you pay enough attention to studying it!
Elements of the tab control panel: 
If you need to select only 25-50 Hz inputs then continue entering the name input type further, inputs 25-50 Hz can be selected by entering 25- and inputs 12-25 Hz by entering 12- or -25
When the button is released, a separate plotter is used for each signal, this display mode is convenient to use when visual comparison of signals (for example, when setting vibration sensors distributed in space or assessing the voltage drop on the line)

If only the Settings button is pressed, then the input settings are displayed in separate tables:

Forced alarm - generates an “Alarm” event for the selected inputs - this action is useful when debugging system reactions and group interactions in zones, and can also be used as a manual alarm notification
Process alarms - processes (ends) active “Alarm” events on the selected inputs. >Please note that alarm processing does not block the creation of new alarms if the “Alarm” event generation criteria is preserved. New alarms are blocked only when the input is disarmed.
Disarm - disarms the selected inputs. When disarming, the input does not generate the “Alarm” event, but monitoring of the correctness of the input and communication with it - continues
Arm - arm the input.
Zones are managed through the zone editor, which is launched by pressing the Zones button on the system application panel.

The editor window contains: - button New zone - when pressed, creates a new zone in the system - button Delete - when pressed, deletes the selected zone - list of zones in the system that displays the zones and their current status - control panel for the zone composition (entrances) - zone settings table The
information in each tab is divided into two parts - the elements that are already included in the zone are displayed on the left, the elements on the right that are available for inclusion in the zone. In the middle there are buttons for adding or deleting elements - to add an element, select it in the left part of the tab (you can select several elements by selecting them by holding down the Ctrl or Command key on the keyboard if the application is running under MacOS) and click on the < key (highlighted in green). To delete an element - select it in the right part of the tab and press the > key (highlighted in red). The elements available for inclusion in the zone are displayed in a hierarchical tree that includes the elements themselves (displayed as a sheet) and their parent fixtures (displayed as a folder):

If all available child elements the parent device is already included in the zone, or the device does not contain suitable subordinate elements, it is displayed as a sheet (in the picture above, “BO-Zone Poplar Zone BO No. 1” is displayed like this). To add all subordinate elements of the device to the zone, you can select and add the device itself, to select individual subordinate elements - click on the triangle to the right of the device icon in the list.
The table of inputs already included in the zone contains the following fields:

Please note! Input settings are global and changing them in one zone will also change them in other zones where this input is enabled!
- The following criteria can be used to generate an “Alarm” notification for a zone
- AND“,”OR“,”2 of 5“, etc.) - The total number of threshold exceedances by the signals of the inputs included in the zone exceeds the specified value (search for multiple effects) - The total amount of energy of the signals of the inputs included in the zone , exceeds the specified value (definition of global or long-term impacts) - The energy of one of the inputs exceeds the energy of another input in the zone by the specified number of times (search for local disturbances in the zone that distinguish the violator from the large-scale natural impact) - By weight coefficient - search for an event withpriority
signal the
accountcontains:**

For example, these settings will generate an “Alarm” notification for a zone if: - 5 or more inputs go into the “Alarm” state at the same time - Signals in the zone exceed the threshold by 10 or more times in 10 seconds ( the exceedance window is personal for each input and can vary) - The total energy of the signals in the zone will exceed the value of 15000 in 10 seconds (the energy window is also personal for each input and can vary) - The energy of any of the inputs will exceed the value of 500 and will be at least 3 times the energy of any other input - Inputs in the “Alarm” state will accumulate 600 or more points of weight in total - for example, the inputs “6-12 Hz” and “12-25 Hz” will work simultaneously (300+300>=600), or simultaneously the inputs “1.5-3 Hz”, “3-6 Hz”, “25-50 Hz”, “50-100 Hz” (150+200+150+100>=600) will work.
controllers Zone controllers create additional work tabs in the left work area of the main application window, each zone controller is its own tab with its own a personal set of zones and display grid settings.
In the zone controllers editor there are: - the current list of controllers - an input field for changing the name of the selected controller - an input field for changing the number of columns that are used to display the selected controller in the main application window - buttons for creating, saving and deleting controllers.

When a controller is selected from the list, the zones available in the system are displayed in the right part of the window. To add a zone to the controller, it is enough to check the box to the left of the zone name, to remove the zone from the controller, the box must be unchecked.
Actions (programmed system responses) are controlled either through the program code editor by the engineer when setting up the system, or by the operator through the action editor, which is launched by pressing the Actions button on the system application panel.
In the program code editor, the engineer has many more options for system reactions and a more flexible logical organization of the relationships between system objects and reactions to their changes.

The editor window contains: - Actions control panel containing the following controls: - Save button - when pressed, saves the settings for the selected action - Create* button * - when pressed, creates a new action in the system - Delete** button - when pressed, deletes the selected action - Enable button - when pressed, forcibly turns on the action (transfers all outputs associated with the action to the activation state) - button * *Disable - when pressed, forcibly disables the action (transfers all outputs associated with the action to the deactivated state) - input field Name - displays the current name of the selected action, when the data in the input field changes, after saving the action , it will be given a name corresponding to the text entered in the field. - drop-down list for selecting the type of action - input field Options for entering additional parameters of the action. - List of actions in the system which displays the actions and their current status (green - enabled, not activated, blue - enabled, enabled, black - disabled) - Tabs for managing the composition of the action - inputs, outputs and zones**
Each action must contain at least a data source (input or zone) and a controlled output (loop, relay, software interface, data output interface, etc.)
The information in each tab is divided into two parts - elements that are already enabled are displayed on the left to the action, on the right - the elements that are available for inclusion in the action. In the middle there are buttons for adding or deleting elements - to add an element, select it in the left part of the tab (you can select several elements by selecting them by holding down the Ctrl or Command key on the keyboard if the application is running under MacOS) and click on the < key (highlighted in green). To delete an element - select it in the right part of the tab and press the > key (highlighted in red). The elements available and already included in the action are displayed in a hierarchical tree that includes the elements themselves (displayed as a sheet) and their parent fixtures (displayed as a folder):
If all availableelements of the parent device are already enabled or the device does not contain suitable subordinate elements, it is displayed as a sheet (in the picture above, “BO-Zone Topol Zone VO No. 1” is displayed like this). To add or remove all subordinate elements of the device from the action, you can select and add or remove the device itself, to select individual subordinate elements, click on the triangle to the right of the device icon in the list.
Binding actions to zones containing inputs, and not to the inputs themselves, provides more flexible settings and does not require additional actions when changing the composition of zones - for example, when deleting an input from the zone to which the action is attached, it is not necessary to delete the input from the settings of the action itself .
Graphical object plans are managed through the plan editor, which is launched by pressing the Plans button on the system application bar.

Graphic object plans are saved on the server and sent to clients when the plan settings are changed or when the client starts. Plans consist of three main elements - a raster plan substrate, which can be used as a satellite image from GIS systems, a schematic image of an object or its scheme from a CAD package (for example, from AutoCAD), interactive graphic polygons and mnemonic symbols. Plan elements can be linked to various system objects - devices, their inputs and outputs, as well as zones. As a rule, it is optimal to use zone bindings to display schematic information using graphic polygons, and input bindings to display detailed technical information using mnemonic symbols.
Before editing the plan, you must select a plan from those already existing in the system or create a new one - this is done using the drop-down list on the application control panel or using the Create button. The changes made to the plan are saved by pressing the Save button . To delete the selected plan, click the Delete plan button. The Name input field displays the current name of the plan and allows you to change it. The Upload background button allows you to upload a new graphical bitmap file with the image of the plan background Background** drop-down list allows you to select the plan background from the files already uploaded to the server. The + and - keys control the scale plan display
The right side of the application displays the current state of the selected plan.
located on the left side of the application: - Drawing for managing graphic polygons - Placing for managing mnemonic elements
areas well as geometry and binding settings for the selected element. To create a new plan element (polygon), press the Add button under the list of elements. A new item named “New Item” will appear in the list and will be automatically selected for editing. Click on the Add points button and select the first point of the polygon on the plan (on the right side of the application) by clicking on the plan - it will be added to the Points table and displayed as a circle on the plan. Add a second polygon point - a connecting line will appear between them. Continue adding polygon points one by one, the polygon will be filled with color.

When all the points have been added, uncheck the Add points button and click the Save button to save the changes.
mode In the placement mode, mnemonic symbols are placed on the graphic plan, displaying the current status of the system elements. Group and single accommodation is possible.
To plot several elements of the system evenly distributed along a straight line on the plan, select the elements in the list of available devices, press the button Place along the line, on the plan, by clicking the mouse, specify the start point of the placement line, then, with the second mouse click, specify end of placement line. All selected devices will be added to the plan, along the line connecting the first and second points, with uniform indents from each other. Press the button Place along the line. This mode is convenient for placing point vibration sensors and other distributed signals inside the protected area.
To place single objects on the plan, select the required object in the list of available devices, hold down the Place on the plan button and specify the place on the plan where you want to display it. Until the Place on plan button is released, you can select the following objects in the list of devices and place them on the plan. Upon completion of the placement of objects, release the button Place on the plan

The mnemonic objects created as a result of placement will be available in the list of graphic elements of the plan
To edit settings server and client have a separate application, which is launched by pressing the Settings button on the system application panel.

The application contains tabs for general and network settings, enabling and disabling debug information, client settings, and the backup management panel.
When a setting is selected, its detailed description and control buttons will be displayed - for “on-off” settings, the on-off button and the Save button, when pressed, the new setting value will be saved:
For settings with a specific value, the current value is displayed, the on-screen keyboard call button and the Save button, when pressed, the new setting value will be saved:

Please note that changing many settings, without a clear understanding of their meaning, can lead to a malfunctioning or completely inoperable system. Before making changes, back up the server, and before changing the LAN settings, make sure that the instrument will be available to you from the local physical console if you make a mistake while configuring it.

The backups control panel contains the following controls: - button Refresh list - requeries the list of backups on the server - button Create backup of settings* * - creates a new backup copy on the server, which includes all elements of the system - devices, zones, actions, plans, etc. - the button Create a backup copy of the event log** - creates a new backup copy of the event log on the server - the button Restore from the selected copy - restores all elements of the system or the event log (depending on the type of backup selected) on the server from selected backup - a table of available backups. The name of the backup file includes the following information: - BKPSettings - prefix of the settings backup file name, BKPLog - prefix of the event log backup file name - Date and time the backup was created in the format Year-Month-Day_Hour-Minute-Second - File extension . zip for files in Zip archive, .tar.gz for files packed in Tar with GZip compression - button Download the selected backup - by clicking on the button, the client will download the backup selected in the table to the folder of its location (Topol file location .jar on the PC with the client) - the button Upload a copy to the server will bring up a file selection dialog in which you can select the backup copy located on the PC where the client is running, to transfer it to the server. After the transfer, the copy can be deployed to the server using the button Restore from the selected copy
The last button on the application bar is Menu. It calls the menu of actions with the system
 The
The
following actions are available: - Synchronization of time - synchronizes the real time clock of the server with the clock of the PC running the client (i.e. the current time of the client will be set on the server) - Update server - checks for software updates on the Internet (if the server has Internet access) and, if any, installs a new version on the server. After the software update, the server will be automatically rebooted. - Update AWS - checks for software updates on the Internet (if the client has Internet access) and, if available, installs a new version on the PC of the current client. After updating the software, the client can be automatically restarted (under Linux OS) or it will need to be manually restarted by the operator (under other OS).
Pay attention! For correct operation, the client software must have the same version as the server software.
configuration added IP cameras.
Cameras can be added to the control panel of devices both automatically in the search tab -> onvif search, and manually using the “Add” button -> IP camera

In the video verification mode, the system supports most video cameras that can work on RTSP, RTP and HLS protocols, a number of cameras broadcasting data via MJPEG are supported.
In photo verification mode, the system supports any data sources in JPEG, PNG, BMP formats, including most video cameras

After adding a video camera to the system, you need to make sure that the following fields are filled in correctly:
- IP - IP address of the camera - Login - if the camera requires authorization, then you must specify the username here - Password - if the camera requires authorization, then you must specify the user password
here for reading events
It is not necessary to fill in all fields of references to camera data, but system functions associated with empty fields will be limited
Video camera data sources are available in the system as executive devices in the “outputs” tab:

Turning on the output starts recording video data, turning it off ends it.
For video cameras added to the system, three additional buttons are available in the dashboard for displaying real-time data on the settings panel:

RTSP video - output the main stream of the camera, broadcast directly from the camera. For this mode, the camera must be available from the client network, using camera resources and network traffic in the camera-client segment.
Video RTMP MAIN - output the main stream of the camera stream from the buffer to the server RAM. For this mode, client access to the camera is not required, camera resources are not used, traffic in the server-client network segment is used
Video RTMP SUB - output of the camera stream substream from the buffer to the server RAM. This mode does not require client access to the camera, camera resources are not used, traffic in the server-client network segment is used
In the “Record type” field in the camera settings, you can select the following recording modes:
1 - recording on demand - data recording will start at the moment the action is activated (by alarm, malfunction or other event).
This mode has two drawbacks:
1) If the recording is carried out on alarm, then the recording will start only at the moment when the decision to alarm has already been made, and the intruder’s approach to the protected area before the sensors are triggered will not be recorded.
2) Data for displaying on plans or in the camera settings panel will be available only in the direct access to cameras mode
. noticeably more cameras can be connected to the system than the network bandwidth, RAM size or disk subsystem speed allows, while the amount of traffic from the cameras will be minimal.
2 - on-demand recording with pre-recording - data from the cameras are constantly broadcast to the server in a buffer in RAM. When an action is enabled (on an alarm, malfunction or other event), data is written to the disk 10 seconds (the time can be set in the settings) before the event is turned on, during the event is active and within 10 seconds (the time can be set in the settings) after the end of the event.
In this mode, real-time data broadcasting directly from the server is available to clients, which significantly reduces the load on cameras and the camera-server network
segmenthard drives constantly, regardless of the activity of actions
toon demand without pre-recording on cameras with low priority or limited traffic
To record camera data in modes 1 and 2 (on-demand recording without and with pre-recording), you need to create actions with the following settings:
< img src=“videoCameraActionRecord.png”>
Inputs or zones - specify what will trigger the recording, for example, the zone in which you want to enable camera recording on alarm
Outputs - specify which camera data source you want to record - main channel, subchannel or screenshot for photo verification
Action type - “Enable output”
Action initiator - specify which event will trigger the action, for example “Alarm”
7.2 Linking with events

###interval next to the occurred event, switch to the event view mode and turn on the “Video” switch

If the switch is on, when you select an event in the list, the system will scan all available data sources for records in them in the time interval next to the event.
Data sources containing events will be displayed on the left side of the panel in the form of buttons that provide switching between sources
Under the video output window there are controls:


access the archive of video verification fragments in the “Monitoring” mode, select the “Archive” tab, which is located behind all available plans in the system

In the panel all fragments from all video cameras are available for viewing the archive without reference to specific events m.
The panel contains the following interface elements:

Video camera selector - select the camera whose data you want to view
Video switcher - if the switch is enabled, then when selecting a video fragment it will automatically be played, if the switch is turned off then the panel only displays the available fragments but does not play them.
Switch “Archive” - if the switch is enabled, the system will automatically scan all available storage locations when a video camera is selected.
Date selector - when a camera is selected, the valid selector values are filled with dates for which video data fragments are available.
Layout selection selector - allows you to select the discreteness with which time intervals are displayed on the panel. For example, if the value “2” is selected, then each button on the panel displays the availability of video fragments for two minutes.
Buttons for selecting video fragments - the table of buttons is formed by hours and minutes, taking into account the selected time resolution. Green indicates discrete time intervals containing available video data, gray - time intervals without available video data

To select a video fragment and start playing it, click on the time segment button - playback will start in the first video fragment in the selected segment.
Below the video output window there are controls similar to the video output panel in the event viewer mode
Video data from cameras in real time can be displayed directly on object plans:

To do this, in On the “Cameras” tab in the plan settings, specify:
Separator position - initial relative position of the plan camera separator where 0.9 - leftmost position, 0.1 - rightmost position, 0.5 - separator in the middle of the plan output window
Number of columns - how many columns the grid of the camera output window will be divided into, for example, if you have 16 cameras and want to display them in 4x4 format, then specify 4
In the table with cameras, select the cameras that will be displayed on the selected plan - cameras highlighted in green are displayed , red - no
For each plan, you can select your own set of cameras, grid and separator position

Sample – e a single item of data received from the instrument during communication. If the device, during the exchange process, returns one value (for example, one value of 22C for a temperature sensor), then this is one sample with a value of 22 and a registration time equal to the exchange time. If the device returns several measurements at once for the same loop (for example, a temperature sensor is polled once a minute and returns a buffer of 6 values measured every 10 seconds), then these are six samples each with its own value and measurement time. Workstation - workstation ISO - integrated security system SSOS - information collection and processing system DLOG (DLOG) - data logging subsystem ISO Topol LAN - local computer network PC - personal computer Software - software OS - operating system IPv4 - IP protocol version 4 according to RFC 791 https://tools.ietf.org /html/rfc791 SSH – Secure Shell protocol in accordance with RFC 4251 https://www.ietf.org/rfc/rfc4251.txt
NPF Poliservice, Stanislav Orlov, 2022
| Приборы | Фото |
|---|---|
| User manual | |